
Accurately Evaluating Filter Press Economics: A Practical Guide to Price, Total Cost of Ownership, and ROI
When making a decision to implement a filter press, it is essential to evaluate not just the purchase price of the equipment, but the Total Cost of Ownership (TCO), which integrates both operating costs and cost-reduction benefits. In the US market, adoption models vary widely—ranging from small manual units to large fully automated systems—and what creates economic rationality depends heavily on your company's specific operating conditions.
This article outlines the variables of initial investment, the structure of operating costs, the quantification of cost savings, cost characteristics by equipment type, and the conditional branching of ROI. Finally, we will introduce filtration testing as a vital means to reduce uncertainty in investment decisions.
1. The Full Cost Picture: What Filter Press "Price" Doesn't Show
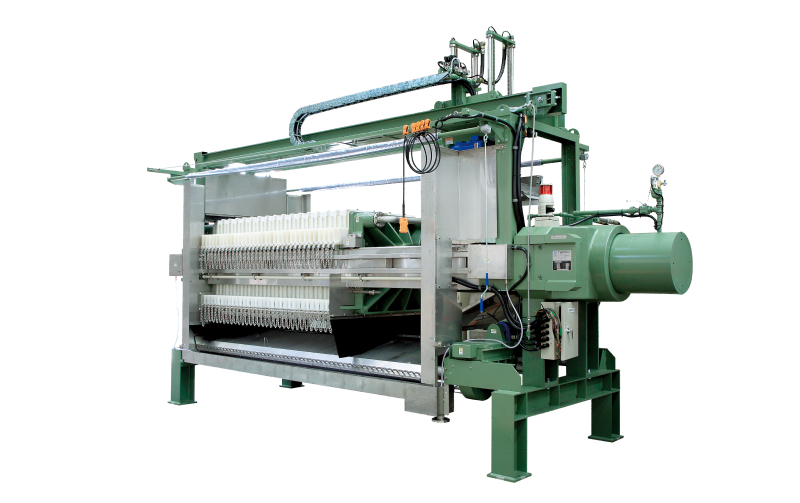
Because filter presses operate over a lifespan of 10 to 20 years, comparing purchase prices alone fails to capture the full economic picture. This section outlines why relying solely on price comparisons can lead to flawed decisions, and why evaluating through the lens of Total Cost of Ownership (TCO) is essential.
1.1 Why Purchase Price Alone Doesn't Tell the Whole Story
The purchase price of a filter press spans a wide spectrum, typically starting around $30,000 to $50,000 for small manual units, ranging from $300,000 to $350,000 for mid-sized fully automated systems, and exceeding $600,000 for large-scale production models (fluctuating significantly based on size, materials, and the scope of automation).
However, over an equipment lifespan of 10 to 20 years, the cumulative operating costs (consumables, maintenance, labor, and utilities) and cost savings generally pack an economic punch equal to or greater than the initial investment. This is precisely why buyers experience a "flip" in long-term value, discovering that a cheaper machine can lead to ballooning operating expenses, while a higher-end system ultimately delivers superior TCO.
1.2 The TCO (Total Cost of Ownership) Evaluation Framework
TCO is an evaluation metric that integrates all costs and savings generated from the installation of equipment through to its disposal. For a filter press, it is most practical to analyze this across three distinct layers:
- Initial Investment (CAPEX): Equipment purchase, installation, and auxiliary engineering.
- Operating Expenses (OPEX): Energy/utilities, consumables, maintenance, and labor.
- Cost Savings: Reduced disposal fees, improved recovery rates, water recycling benefits, and labor reductions.
The evaluation formula is expressed as: TCO = CAPEX + (OPEX × Years) − (Savings × Years)
By plugging your company's specific operating conditions into this formula, you can compare different systems based on true economic viability rather than just the initial unit price.
Before Estimating Your Cost Structure
Total Cost of Ownership (TCO) can vary significantly depending on equipment type, slurry moisture content, and maintenance conditions. As a starting point for evaluating costs under your specific operating conditions, we recommend consulting with us and reviewing our product catalog.
■ Cost Estimation & Technical Consultation
Identify the key cost factors based on your slurry characteristics and capacity.
Technical Inquiry■ Product Catalogue
Learn about equipment design, key features, and industry applications.
2. Key Variables Driving Initial Investment
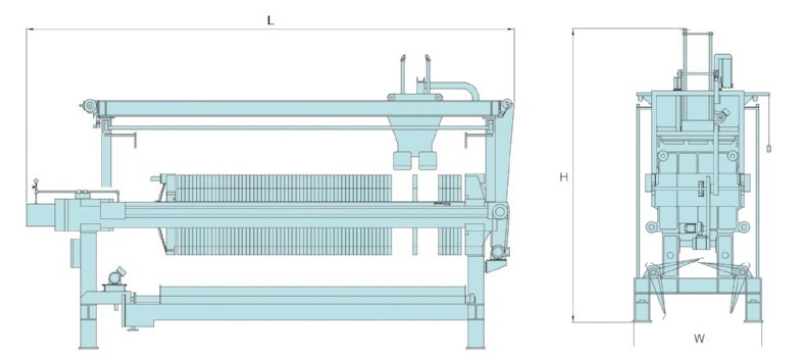
CAPEX is primarily determined by four key variables: equipment type, sizing, automation level, and auxiliary systems. Understanding how each of these factors fluctuates makes it much easier to build a reliable rough estimate tailored to your company's specific requirements.
2.1 Price Ranges by Equipment Type (Chamber, Membrane Squeeze, and Plate & Frame)
Chamber (Recessed) Filter Presses offer high versatility and handle a wide range of applications, making them a relatively cost-effective option to implement.
Membrane Squeeze (Diaphragm) Filter Presses feature built-in membranes within the chamber plates. They are ideal for applications where you need to drastically lower cake moisture content during the squeezing process. While the upfront equipment cost is higher, the substantial savings in disposal fees make it much easier to achieve a superior TCO.
Plate & Frame Filter Presses are a traditional style selected for specific applications—such as pre-coat filtration, pharmaceuticals, and food products—thanks to the flexibility in frame thickness and the ease of integrating cake washing cycles. However, they are less versatile than chamber-style units.
(For a deep dive into the structural designs and mechanics of each type, please see our dedicated article on Types of filter press. For more details on where plate and frame models fit best, refer to our guide on Plate and frame filtration Filter press applications.)
2.2 Cost Fluctuations Based on Sizing (Filtration Area) and Throughput
The required filtration area is determined by combining the plate size (ranging from 300 mm to 2,000 mm classes) with the total number of plates, and this factor heavily drives the equipment cost. Once your processing volume and target cycle time are established, you can calculate the necessary filtration area.
Oversizing results in wasted CAPEX, while undersizing leads to insufficient throughput, which increases the number of cycles and ultimately drives up OPEX. For a new process, the most reliable approach is to determine the correct sizing based on empirical data obtained through filtration testing.
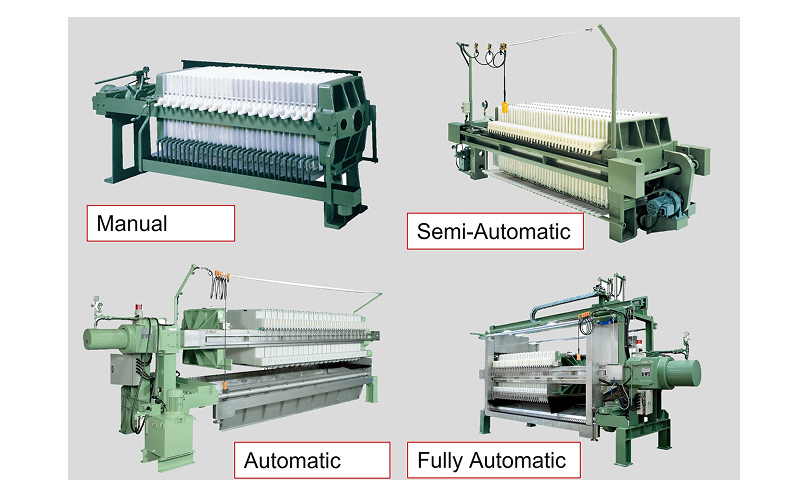
2.3 Cost Differentials by Automation Level (Manual, Semi-Automated, Automated, and Fully Automated)
Manual units are easy to implement with a low initial investment—typically starting around $30,000 to $50,000 for small sizes—but face tight constraints on throughput and labor costs because plate shifting, cloth washing, and cake discharge must all be done by hand.
Semi-automated and automated units mechanize certain steps of the process, reducing operator workload and cycle time delays.
Fully automated units drive upfront costs up—ranging from $300,000 to $350,000 for mid-sized options and exceeding $600,000 for large-scale production models. However, because they drastically slash operating expenses through unmanned night shifts and labor savings, fully automated units easily deliver a superior TCO once throughput volumes or the number of daily shifts cross a certain threshold.
(For a detailed breakdown of these automation tiers, please refer to our dedicated article on Automatic filter presses)
2.4 Ancillary Costs for Installation and Setup
Beyond the core equipment itself, ancillary costs accumulate from foundation work, piping, electrical engineering, control system integration, permitting, and commissioning. Depending on site-specific conditions, these expenses can sometimes match the price of the filter press itself.
The AUTOPAC (PRO) packaged unit features an integrated control panel, hydraulic unit, and piping built right into the machine, making it ideal for fast-track installations with shortened construction lead times. However, it cannot accommodate modifications that deviate significantly from its standard specifications, and its regulatory compliance status for North American specifications must be verified separately.
3. Operating Cost Structure (OPEX)
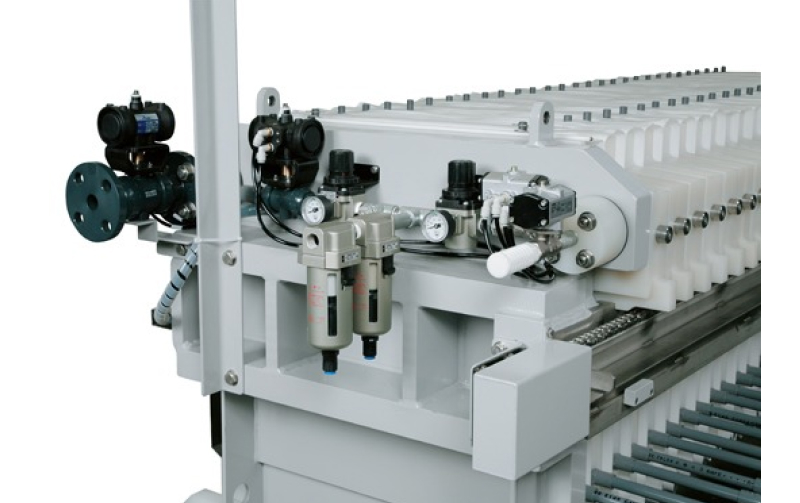
OPEX is primarily composed of four elements: energy/utilities, consumables, maintenance, and labor. Your choice of equipment type and automation level heavily influences every single one of these factors. Over a typical 10-year equipment lifespan, it is not uncommon for cumulative operating costs to equal or even exceed the initial investment.
3.1 Energy Costs (Pumps, Hydraulics, and Control Systems)
Energy consumption in a filter press setup is primarily driven by the slurry feed pump, hydraulic unit clamping and releasing, the squeeze pump (for membrane squeeze units), and the control system. Operation runs on a batch cycle, so the latter half of the cycle focuses heavily on cake squeezing and pressure maintenance, creating an operational structure that constantly alternates between peak power loads and standby mode. Since total power consumption is determined by throughput volume, squeeze pressure, and cycle time, optimizing the cycle through automation makes it much easier to curb energy use per unit of processed material.
3.2 Consumables: Replacement Cycles and Expenses for Cloths and Plates
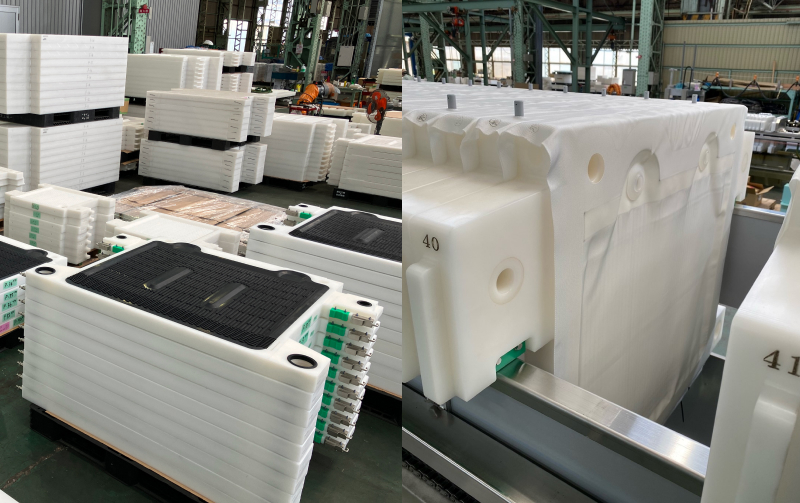
The primary consumable in a filter press is the filter cloth. Depending on slurry characteristics, operating conditions, and material selection, filter cloths typically require replacement every few months to a year, with a full set costing anywhere from several hundred to several thousand dollars. Beyond the unit price of the cloth itself, selecting the material and weave (weight) best suited to your slurry directly impacts how effectively you can minimize replacement frequency and prevent blinding (clogging). Consequently, this choice heavily drives your annual consumables expenses. Filter plates are also a major structural component of the equipment. However, our filter plates are engineered for high durability; under proper operating temperatures, they are designed to last without requiring routine replacement so to accurately estimate your consumables costs, the essential starting point is to identify the specific filter cloth type that matches your company's slurry.
3.3 Maintenance and Repair Costs
Maintenance expenses consist of routine preventive maintenance (cleaning, lubrication, seal replacements, and hydraulic inspections) and unplanned repairs (handling leaks, severe blinding, and corrosion issues). Executing a well-planned preventive maintenance program simultaneously extends equipment lifespan and minimizes costly downtime. Maintenance costs depend heavily on equipment design, such as accessibility, quick-change cloths, and structural simplicity. Reviewing these features during procurement drastically reduces your operational burden down the road.
3.4 Labor Costs (Correlation with Automation Levels)
Manual units require a dedicated operator on-site at all times, resulting in high labor costs. Conversely, fully automated units enable lean staffing and unmanned night shifts, drastically driving down labor expenditures.
In the United States, industrial operator labor is typically evaluated using a loaded labor cost (total labor cost including direct wages, social security, insurance, and benefits), which generally ranges from $60 to $80 per hour.
Assuming a fully automated unit saves 3 to 4 hours of dedicated operator time per shift compared to a manual unit, a two-shift operation creates an annual labor cost differential of tens of thousands of dollars. This gap serves as a practical benchmark for calculating the payback period on your automation investment. Ultimately, the larger your throughput volume and number of daily shifts, the stronger the economic justification for high-level automation.
4. Cost Reduction Benefits of Filter Presses
When evaluating TCO, it is vital to account for cost-saving benefits alongside upfront and operational expenditures. A filter press primarily drives savings in three areas: waste disposal cost reductions, valuable material recovery/water recycling, and the mitigation of regulatory compliance risks.
4.1 Waste Disposal Savings: Cutting Weight and Volume via Dewatering
Lowering the moisture content of the filter cake directly slashes industrial waste disposal fees. For example, dropping cake moisture from 85% to 70% reduces the water-to-dry-solids ratio from 5.7x down to 2.3x, which cuts the total weight of the waste roughly in half.
Landfill disposal tipping fees in the US vary significantly by region. According to a 2024 report by the Environmental Research & Education Foundation (EREF), the national average is approximately $62 per ton, while prices jump to around $81 per ton in the Northeast and drop to about $45 per ton in the South Central region. For a plant with an annual disposal volume of 2,000 tons, cutting the cake weight in half would yield annual savings of roughly $60,000 based on the national average, and up to $80,000 in the Northeast.
4.2 Economic Benefits of Product Recovery and Water Recycling
In process applications like chemicals, non-ferrous metallurgy, and battery materials, revenue and yield depend on two key metrics: the recovery rate of valuable materials from the filtrate and the cake purity achieved through washing. Even a marginal increase in recovery rate can deliver a massive annual financial impact on high-throughput production lines.
For wastewater applications, recycling the filtrate as process water reduces municipal/industrial water costs and eases the load on downstream wastewater treatment systems. Uniform cake washing and consistent filtrate quality are the essential prerequisites for unlocking these economic benefits.
(For a detailed breakdown of industry-specific applications and key selection criteria, please refer to our dedicated article on Filter Press Applications.)
4.3 Mitigating Regulatory Compliance Risks (Fines and Operational Downtime Costs)
Industrial wastewater and hazardous waste regulations in the United States are heavily layered and enforced across federal, state, and local levels. Because non-compliance fines or forced operational shutdowns can inflict financial damages that dwarf your entire annual operating budget, it is highly valuable to evaluate compliance costs as a critical hidden variable within your overall TCO.
5. Cost Comparison by Filter Press Type
By integrating the variables analyzed in Sections 2 through 4, this section provides a comparative evaluation of the cost profiles for each equipment type. Please note that these ratings represent general performance trends and will vary based on specific slurry characteristics, target performance goals, and operating conditions.
5.1 Comparison Matrix: Chamber, Membrane, and Plate & Frame
The matrix below outlines the relative characteristics of the three filtration methods across key evaluation metrics.
| Evaluation Metric | Chamber Type | Membrane Squeeze Type | Plate & Frame Type |
|---|---|---|---|
| Initial Investment(CAPEX) | Medium | High | Medium |
| Achievable Cake Moisture | Medium | Low (Desirable) | Medium |
| Disposal Cost Reduction | Medium | High | Medium |
| Consumables Cost | Low to Medium | Medium | Medium |
| Best Suited For | Versatile (Broad range of wastewater & production process) | Processes with stringent cake moisture targets | Specific applications (Pre-coat, pharmaceuticals, food, etc.) |
While membrane presses require a higher initial capital investment, they can achieve a lower TCO over time because the lower moisture content drastically reduces waste disposal costs. Chamber presses offer an excellent balance between versatility and upfront cost, making them the default baseline choice for many applications. Plate-and-frame filter presses, on the other hand, are selected for specific uses—such as precoat filtration and applications in the pharmaceutical and food industries—because of their flexibility in plate thickness and the ease of incorporating cake washing processes.
5.2 TCO Comparison: Manual vs. Automated (5-Year Lifecycle)
While manual units offer a clear advantage in upfront capital investment, they incur significant long-term costs. When factoring in loaded labor costs (often reaching tens of thousands of dollars annually), extended downtime, inconsistent cake quality, and more frequent consumables replacement over a five-year period, automated systems achieve a lower TCO once throughput exceeds a certain threshold.
The key lies in calculating the exact payback period on your automation investment. This should be determined by calculating the combined financial impact of labor savings, increased uptime, reduced reprocessing costs, and lower waste disposal fees. To ensure the accuracy of this financial projection, it is essential to first run pilot tests on your specific slurry to establish precise throughput capabilities and target moisture content.
6. ROI Scenario Analysis: Identifying Processes with the Fastest Payback Period
Building on the TCO framework, this section outlines how to identify which engineering processes deliver the highest return on investment (ROI) based on your plant's specific conditions. We categorize these scenarios using four key variables: throughput volume, slurry characteristics, cake washing requirements, and target moisture content.
6.1 Evaluating ROI via Throughput, Slurry Characteristics, Washing Requirements, and Target Moisture Content
- Throughput Volume: Larger volumes reduce the processing cost per unit of equipment and shorten the payback period for automation, significantly boosting overall ROI.
- Slurry Characteristics: For corrosive slurries (such as those containing acids or chlorides), wetted material selection dictates equipment lifespan, repair expenses, and metal contamination risks—heavily impacting the overall TCO.
- Washing Requirements: Whether cake washing is required and its primary goal (purity versus product recovery) is often the single largest variable driving ROI in process applications. This dramatically elevates the importance of uniform washing.
- Target Moisture Content: In processes with stringent cake moisture targets, utilizing a membrane press to lower moisture content yields a massive, quantifiable reduction in waste disposal fees.
6.2 Contrasting Economic Calculations: Wastewater vs. Process Applications
In wastewater applications, the core drivers of ROI are waste disposal cost reductions, water recycling, and the mitigation of regulatory compliance costs. Conversely, in process applications, the focus shifts to maximizing recovery rates, ensuring product purity, and improving overall yield—factors that can often deliver a far greater financial impact than simple disposal savings. Since key performance indicators (KPIs) for investment decisions change completely depending on the application, it is crucial to tailor your ROI calculation framework to match your specific operation.
(For a concrete selection guide tailored to specific industrial sectors, please refer to our comprehensive article on Industrial Filter Presses.)
Verify Whether the Investment Pays Back in Your Process
The return on investment depends on the slurry property, including moisture content, washing performance, and corrosiveness. Calculations based on assumptions can lead to incorrect premises and undermine the business case after startup.
■ Establish Reliable Investment Criteria Through a Filtration Test
Conducting filtration tests provides actual process data on throughput capacity, achievable cake moisture content, and the optimal filter cloth selection. These results can serve as the basis for TCO evaluations and ROI calculations.
7. Investment Pitfalls: When "Cheap" Costs You More
This section outlines the hidden costs that frequently arise when equipment selection is based solely on the lowest initial purchase price. This chapter also highlights how Kanadevia’s design philosophy directly addresses these real-world operational challenges.
7.1 Premature Degradation and Escalating Repair Costs Caused by Corrosion
- The Challenge: Utilizing equipment with metallic wetted parts to process acidic or chloride-based slurries leads to corrosion-induced leaks, unexpected repairs, and costly downtime. Furthermore, metal contamination poses a severe risk to final product quality.
- The Requirement: A tailored, compatible design for all wetted materials.
- The Solution: A metal-free wetted design (using PP and elastomers) minimizes repair costs and extends equipment life, directly optimizing your TCO.
- Next Step: We highly recommend sharing your specific slurry characteristics with us so we can conduct a filtration test to verify material compatibility.
7.2 Reprocessing and Quality Losses Caused by Inconsistent Washing
- The Challenge: Non-uniform cake washing (channeling) leads to decreased purity, poor product recovery rates, and additional re-washing costs—heavily degrading the ROI of your process application.
- The Requirement: A system designed for uniform slurry distribution and consistent wash fluid delivery is essential.
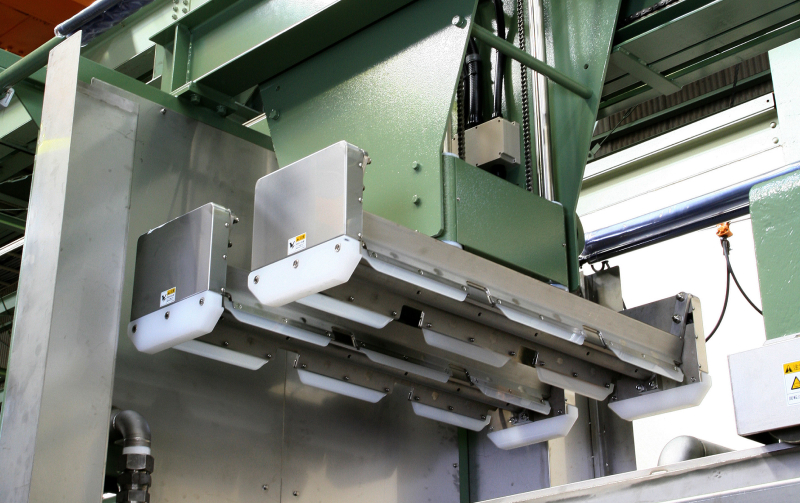
- The Solution: Implementing a double-top corner feed design ensures uniform filtration, dewatering, and washing. This design minimizes reprocessing costs and maximizes recovery rates to directly improve your TCO.
- Next Step: We invite you to share your primary washing goals and key performance indicators (KPIs) with us so we can prepare a tailored technical specification proposal.
7.3 Operational Downtime and Labor Costs Driven by Poor Cake Discharge
- The Challenge: When sticky or cohesive filter cakes fail to discharge properly, it triggers a costly chain reaction: increased manual intervention, unexpected system shutdowns, and heightened safety risks. This directly inflates both labor expenses and downtime costs.
- The Requirement: Reliable, automated cake release is essential to maintaining high equipment uptime.
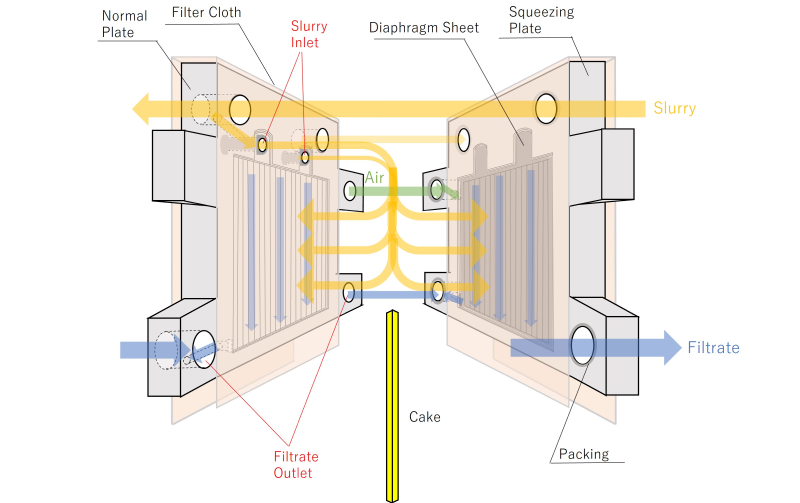
- The Solution: Utilizing an integrated scraper system ensures consistent and stable cake discharge, reducing the burden of manual labor and maximizing operational availability to optimize TCO.
- Next Step: We highly recommend evaluating cake discharge characteristics during a pilot filtration test to ensure compatibility with your material.
7.4 Escalating Maintenance Costs Driven by Complex Cloth Replacement
- The Challenge: The time, labor, and safety risks involved in replacing filter cloths constitute a major portion of long-term maintenance costs. If the cloth installation mechanism is overly complex, maintenance downtime can be prolonged, driving up overall TCO.
- The Requirement: Minimizing maintenance hours and equipment downtime is critical.
- The Solution: Implementing a drape-over, drop-in cloth replacement method simplifies the mechanical process. This allows even facilities with limited maintenance staff to drastically shorten downtime.
- Next Step: We invite you to share your operational and maintenance constraints so we can discuss an appropriate operational design.
8. Eliminating Investment Uncertainty: The Economic Value of Filtration Testing
The greatest risk in any capital equipment investment decision is the uncertainty of whether the system will achieve its expected performance with your plant's specific slurry. Filtration testing is a means to reduce this uncertainty by determining key TCO variables using actual data.
8.1 Validating TCO Variables Through Filtration Testing
Filtration testing allows you to firmly establish the following critical variables:
- Throughput Capacity: Optimizes equipment sizing to prevent over-investing in CAPEX or suffering from under-capacity.
- Target Moisture Content: Quantifies your potential savings in waste disposal fees.
- Optimal Filter Cloth Selection: Enhances the accuracy of long-term consumables cost forecasting.
- Washing Performance: Quantifies product recovery rates and purity metrics for process applications.
- Cycle Time: Establishes the baseline data required for precise OPEX calculations.
Deploying a system without preliminary testing leaves you vulnerable to sizing errors and performance shortfalls, often forcing you to completely re-evaluate your TCO assumptions after the equipment is already installed. To lock in technical specifications as quickly as possible, testing is the most reliable method for making an informed investment decision.
8.2 Kanadevia’s Filtration Testing Capabilities
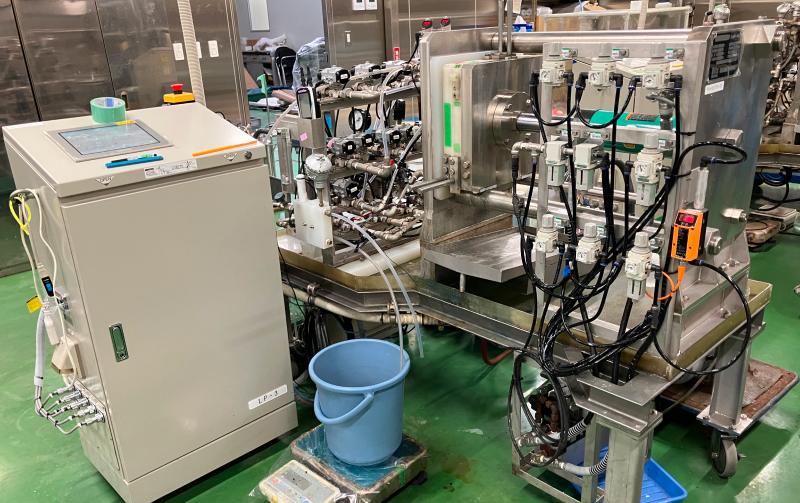
Kanadevia offers comprehensive filtration testing utilizing four single-chamber, 350mm test filter presses (filtration area: 0.117m²; available chamber thicknesses: 25/30/40mm). We fully accommodate on-site, witnessed testing. Based on the empirical data generated from these tests, we can verify throughput capacity, moisture content, and the optimal filter cloth selection, allowing us to advance your project from technical specification proposal to commercial quotation backed by solid data. Note: Feasibility of testing may be subject to review based on slurry properties (e.g., hazardous material classifications).
9. Next Step: Consult with Kanadevia
Don't rely on guesswork to find your TCO and maximize your ROI. Real data is what matters. We support you every step of the way—starting with technical advice and lab testing, all the way to custom engineering designs and final price quotes.
To help accelerate our evaluation, please provide as many of the following details as possible when you contact us:
- Process fluid name/slurry type
- pH, chloride concentration (Cl⁻), and operating temperature
- Solids concentration
- Particle size distribution
- Target throughput volume
- Cake washing requirements (Purity or Product Recovery)
- Target cake moisture content
- Required filtration area
- Chamber thickness preference
- Application type
Next Step
■ Request a Filtration Test / Technical Consultation
Validate your TCO variables using your plant's actual slurry.
■ Request a Quote
Obtain a commercial proposal for projects with established technical specifications.
■ Download Technical Literature
Access helpful resources for early-stage planning.